


How Eliminating Unnecessary Bypasses Can Reduce the Return Temperature by 1.5°C
Optimising and reducing return temperatures is possible by analysing the data that smart meters collect about your distribution network. In this case, a local district heating utility reduced the return temperature by 1.5 degrees by eliminating bypasses that unnecessarily created an increased flow. After removing or adjusting the bypasses, the utility also reduced the overall heat loss in the distribution network by 64 MWh annually.
How to identify an unnecessary bypass
Our data analytics solution, Heat Intelligence is, among other things, able to identify areas in the distribution network with temperature outliers. Figure 1 (left) illustrates a consumer with a temperature deviation of 5.9 °C which has been identified by Heat Intelligence and marked with a red dot. This kind of outlier is typically caused by a flow not accounted for, e.g. a bypass placed in close vicinity of the concerned outlying meter. The increased flow, caused by the bypass, is not included in the model, and therefore, the forward temperature measured by that meter is significantly higher than the forward temperature predicted by Heat Intelligence. Consequently, that meter is marked as an outlier.
After turning the bypass of, the temperature at that customer decreased to 58.3 degrees which is seen on Figure 1 (right).
.png?mw=672&mh=672)
Transparency reduces heat loss significantly
Opening the black box and visualising the actual network status, inferred from meter data, makes it possible to make real data driven decisions on a wide range of complex questions. For instance, which bypasses can be omitted, in order for the utility to significantly reduce heat loss, while at the same time complying with the terms of delivery for the individual customers.
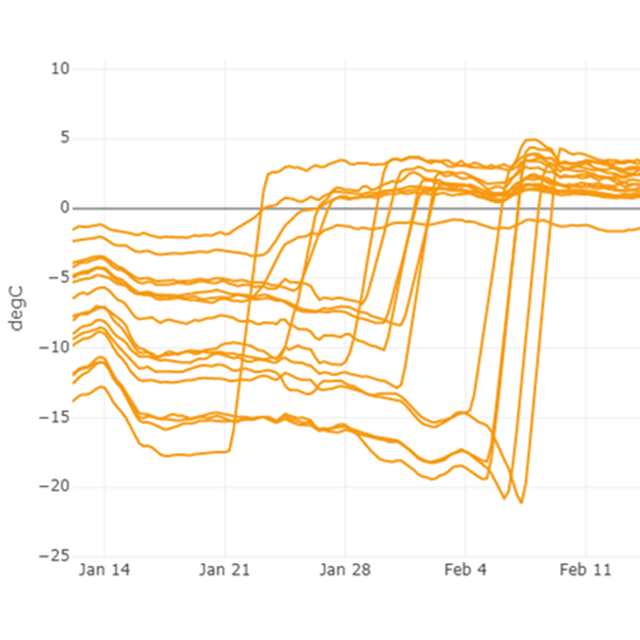
Figure 2 shows the direct result of regulating or turning off a number of identified unnecessary bypasses. The return temperature of that particular zone decreased significantly, from one day to the other, by approximately 1.5 °C. Furthermore, the utility realised a considerable heat loss reduction of up to 64 MWh.

Where to optimise next?
Opening the black box with data analytics creates many optimisation possibilities. It allows you to use your resources efficiently instead of wasting them on unnecessary renovations. Two other examples of optimisations by applying an analytics platform are leakage detection and service pipe performance.

Locating a leak with Heat Intelligence
Heat Intelligence can also identify other green possibilities, for instance, locate leakages in your distribution network. By cross-referencing consumers with regular temperatures and consumers with an unexpected low temperature, you can get a suggestion of where a leak is located, as the point of intersection between unexpected low- and regular temperature can indicate a point of leakage.
Locating badly performing service pipes with Heat Intelligence

Proactive Network Management Through Intelligent Meter Data
It is not only about reacting when leaks or other incidents occur in the distribution network, it’s about using the data from intelligent meters to proactively search for leakages and areas that perform poorly in the area that you supply and generally get a better understanding of the current status in the network – that way you can truly create value for yourself and your consumers.
Do you want to learn more about Heat Intelligence?
Read more about the Heat Intelligence platform and its possibilities here.

Author